Visit
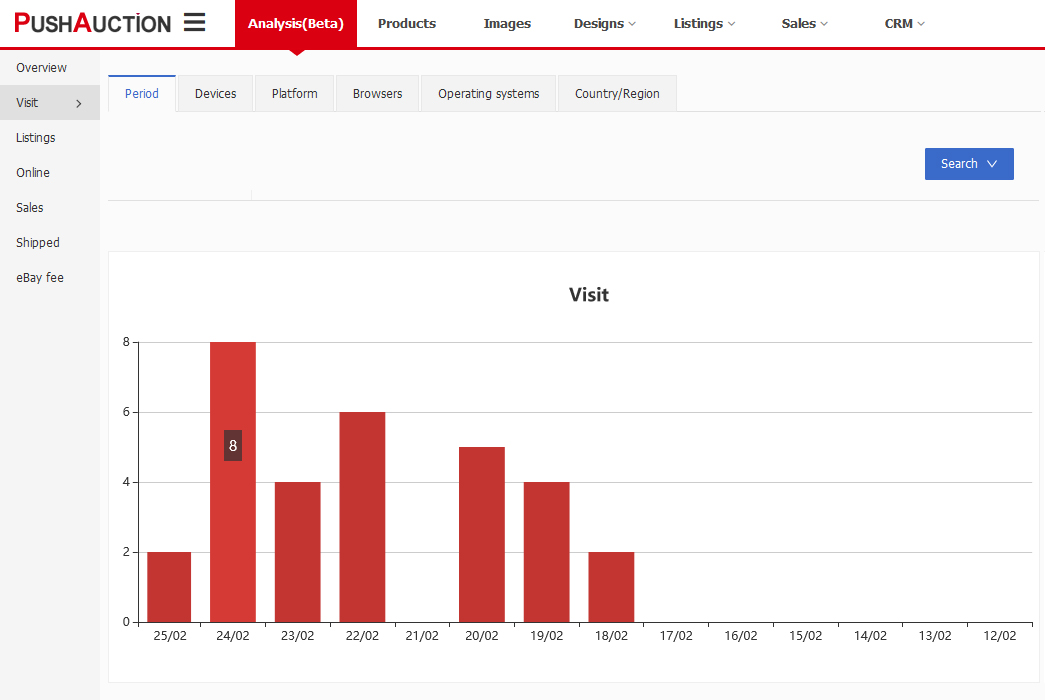
The [Visit] page can count the access data by period, devices, platforms, browsers, operating systems, countries / regions. All these ways support search and statistics by account, site, listing type and visit time. The data bar graph will display the specific data when the mouse stays. Click the [Search] button to set the data query range.
*Display bar chart by period statistics
*Display pie chart and curve chart by device, platform, browser, operating system and country (region).
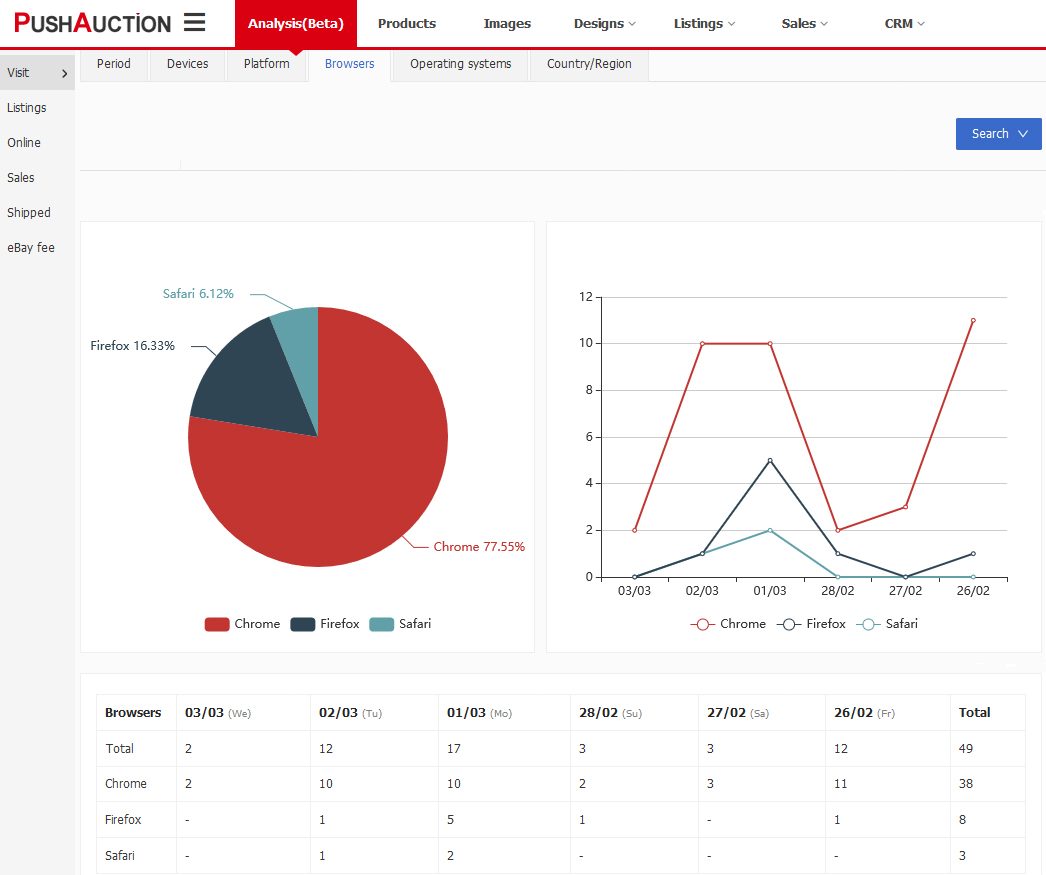
Note: click the item below the chart to add or remove the corresponding data.
Article Number: 1660
Author: Thu, Mar 4, 2021
Last Updated: Wed, Sep 1, 2021
Online URL: https://kb.pushauction.com/article.php?id=1660